
|
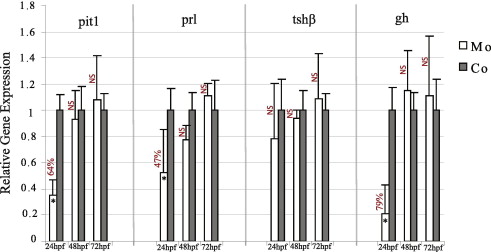
Fig. 3
Morpholino knock down effects for pit1, prl, tshβ and gh assessed by a ΔΔCt method to determine relative gene expression from qPCR data, using ef1a as an endogenous reference gene. In an MO knockdown experiment (MO), ΔCt expression is normalized to a corresponding control sample (Co). Percent knockdown was calculated by subtracting the normalized ΔΔCt expression from 1 (defined by the level of expression for control sample) and multiplying by 100. Error bars indicate SDM for δCt expression in morpholino and control samples. Asterisks indicate statistically significant differences (P < 0.05). NS, not statistically significant. prop1 MO significantly downregulates pit1 (64%), prl (47%) and gh (79%) expression at early but not at late stages.