
|
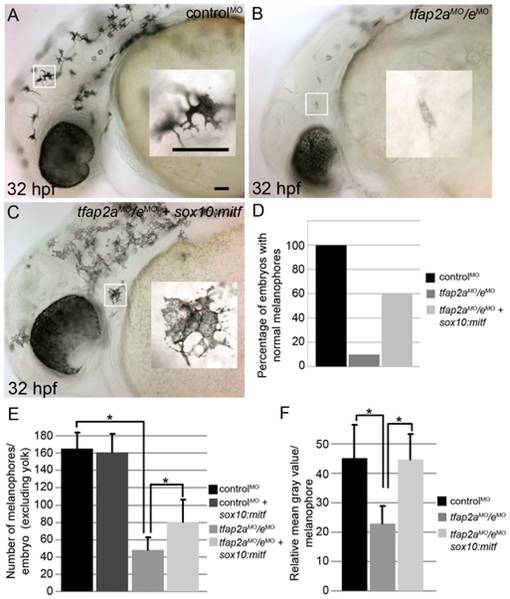
Fig. 8 Melanophore differentiation in tfap2a/e doubly-deficient embryos is partially restored by forced expression of mitfa.
(A–C) Lateral views of 32 hpf embryos, with anterior to the left. Insets are magnified images of the regions in white boxes. (A) A wild-type embryo injected with a control MO, exhibiting normal melanophores. (B) A wild-type embryo injected with tfap2aMO/eMO, exhibiting poorly melanized melanophores. (C) Wild-type embryo injected with tfap2aMO/eMO and co-injected with sox10:mitfa plasmid; melanophores appear closer to normal in this embryo. (D) A histogram presenting percentage of embryos from the various groups with normal melanophores; n = 68 (control MO), 91 (tfap2a/e MO), 89 (tfap2a/e MO + sox10:mitfa), totaled from 3 independent experiments. Scale bars: 50 μM. (E) Histogram presenting average cell counts (±SE) of melanophores in embryos from various groups. Notice an increase in the number of melanophores in tfap2a/e MO embryos co-injected with sox10:mitfa compared to tfap2a/e MO alone (N = 10 embryos per group, asterisks indicate a p value <0.05). (F) Histogram representing average mean gray value (±SE), calculated with ImageJ analysis of photomicrographs of melanophores in indicated groups. Injection of tfap2a/e MO causes a reduction in the mean gray value of melanophores compared to that for control MO-injected wild-type embryos. This value is increased to wild-type levels upon co-injection of sox10:mitfa into tfap2a/e MO embryos (N = 10 embryos per group, approximately 70–80 melanophores per group, asterisks indicate p values <0.05).