
|
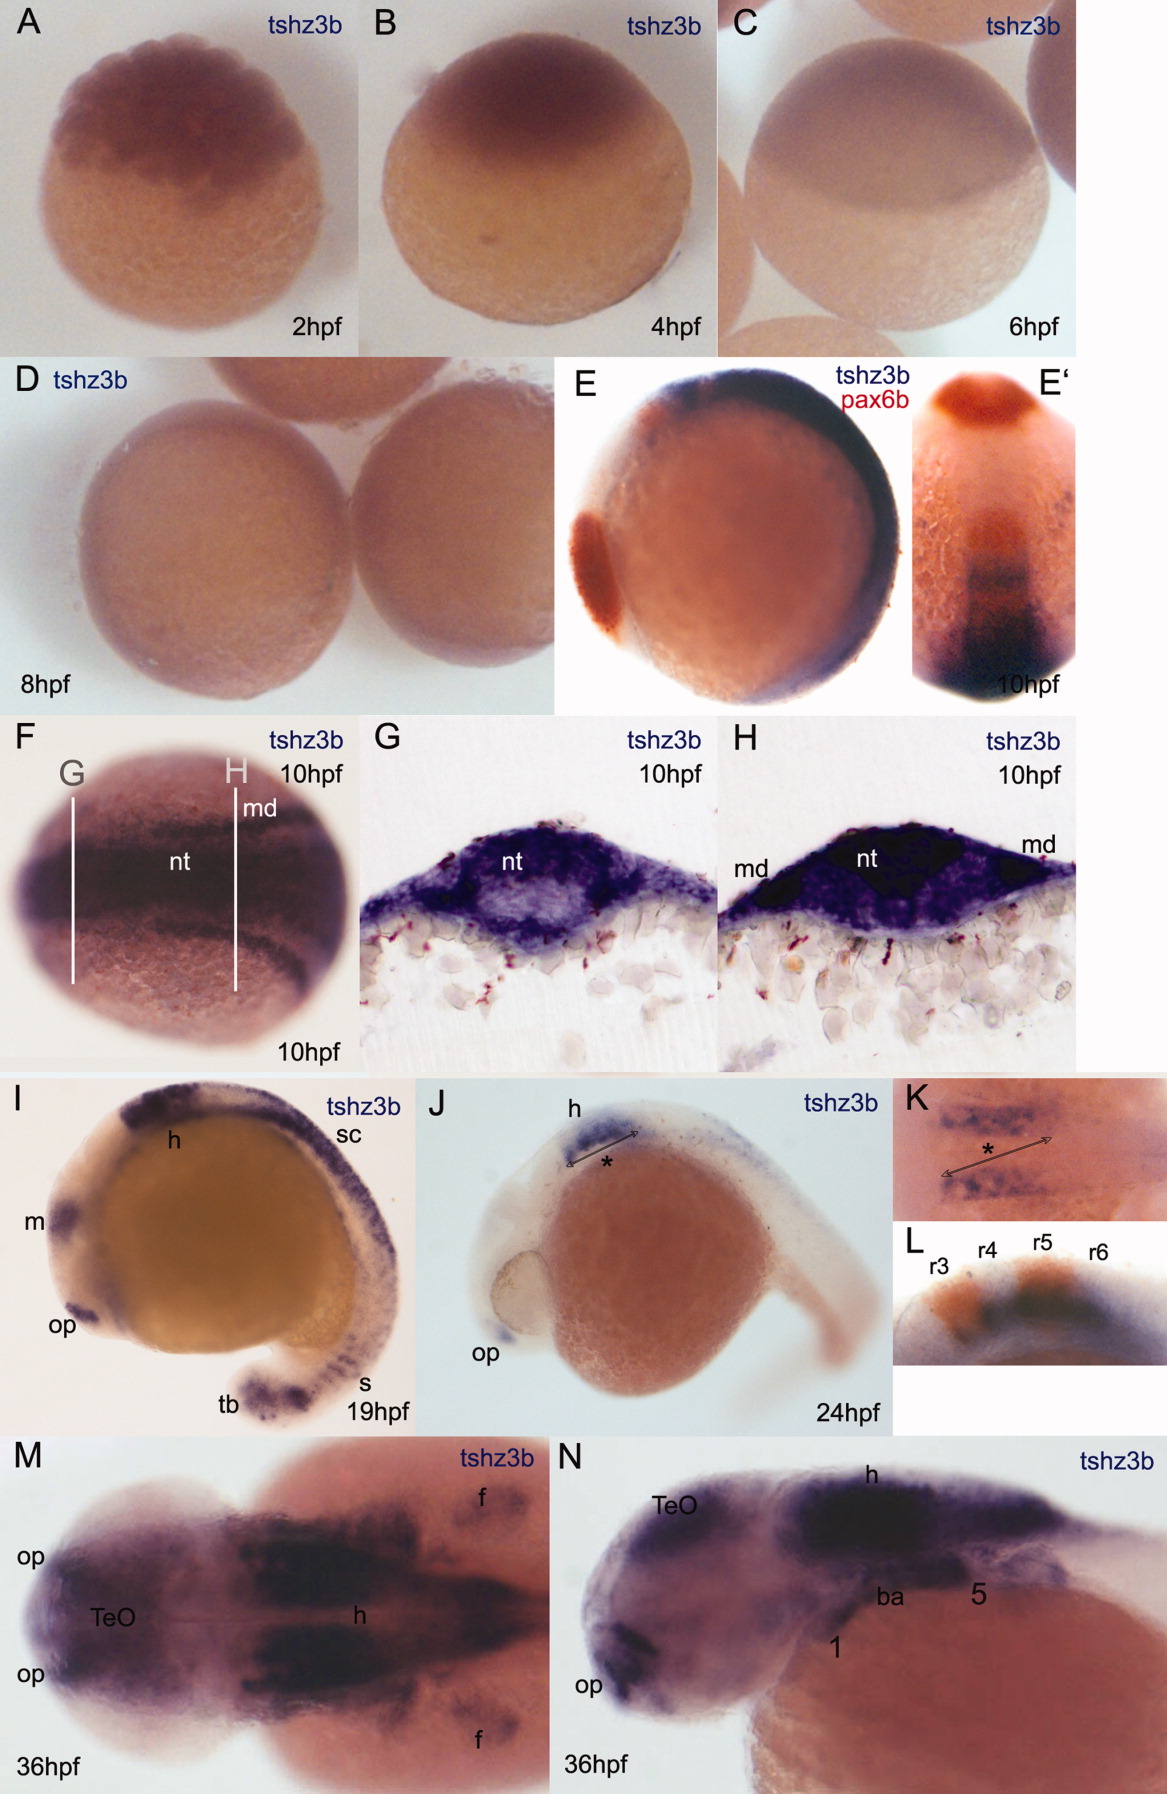
Fig. 3 Spatial and temporal expression pattern of tshz3b detected by RNA in situ hybridization. A-D: Embryos at 2 (A), 4 (B), 6 (C), and 8 (D) hours postfertilization (hpf). tshz3b mRNA is detected in early stages but signal fades by 8 hpf. E,F: At 10 hpf, tshz3b expression resumes and is present from intermediate until the caudal region of the neural tube: lateral (E) and dorsal (F) views. The embryo in E is costained with a pax6b antisense RNA probe. (brown). (E′ is a dorsal view of the same embryo; rostral is up). G,H: Transversal Vibratome sections of a 10 hpf embryo at the anteroposterior levels marked in F. In G, tshz3b is expressed in the dorsal neural tube (nt), but in its most posterior regions (H), tshz3b expression is present both dorsally and ventrally. (md) in (H) marks tshz3b expression in the mesoderm (md). I: At the 20-somite stage (19 hpf), tshz3b is expressed in the olfactory placodes, midbrain, hindbrain, spinal cord, somites, and tail bud. J: At prim-5 stage (24 hpf), tshz3b expression is present in the olfactory placodes and in the hindbrain. K: Dorsal view at the hindbrain level (*) of the embryo shown in J. L: Lateral view of the hindbrain of a 24 hpf embryo marked for tshz3b (blue) and krox20 (brown); tshz3b is expressed from r3 to r6. M,N: tshz3b expression in the anterior region of a 36 hpf embryo. Dorsal (M) and lateral (N) views are shown. ba, branchial arches; f, pectoral fin; h, hindbrain; m, midbrain; md, mesoderm; nt, neural tube; op, olfactory placode; r3-6, rhombomeres 3 to 6; s, somites; sc, spinal cord; tb, tail bud; TeO, tectum opticum.