
Fig. S5
|
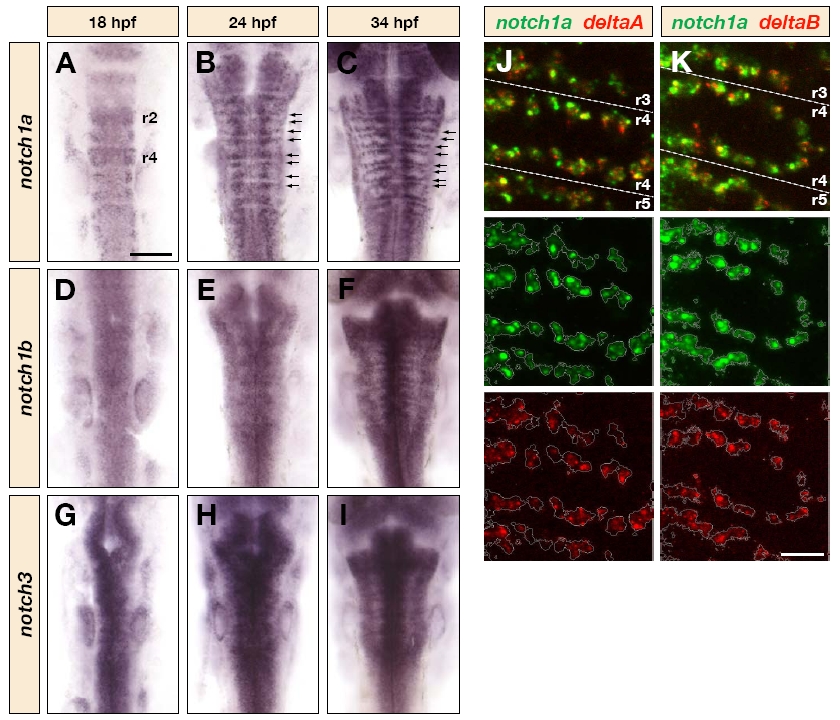
Fig. S5 Expression patterns of Notch genes. (A-I) Dorsal views of wild-type embryos at 18 hpf (A,D,G), 24 hpf (B,E,H) and 34 hpf (C,F,I), showing notch1a (A-C), notch1b (D-F) and notch3 (G-I) mRNA expression in the hindbrain. The arrows in B and C indicate the expression of notch1a in the neurogenic zones. (J, K) Single overlay confocal images showing the dorsal view of wild-type embryos at 40 hpf following detection of notch1a (green) and either deltaA (J) or deltaB (K) (red) mRNA. The expression of notch1a is outlined and compared to that of the Delta genes. Dotted lines indicate the boundary regions. Scale bars: 100 μm in A for A-I; 25 μm in K for J,K.