
|
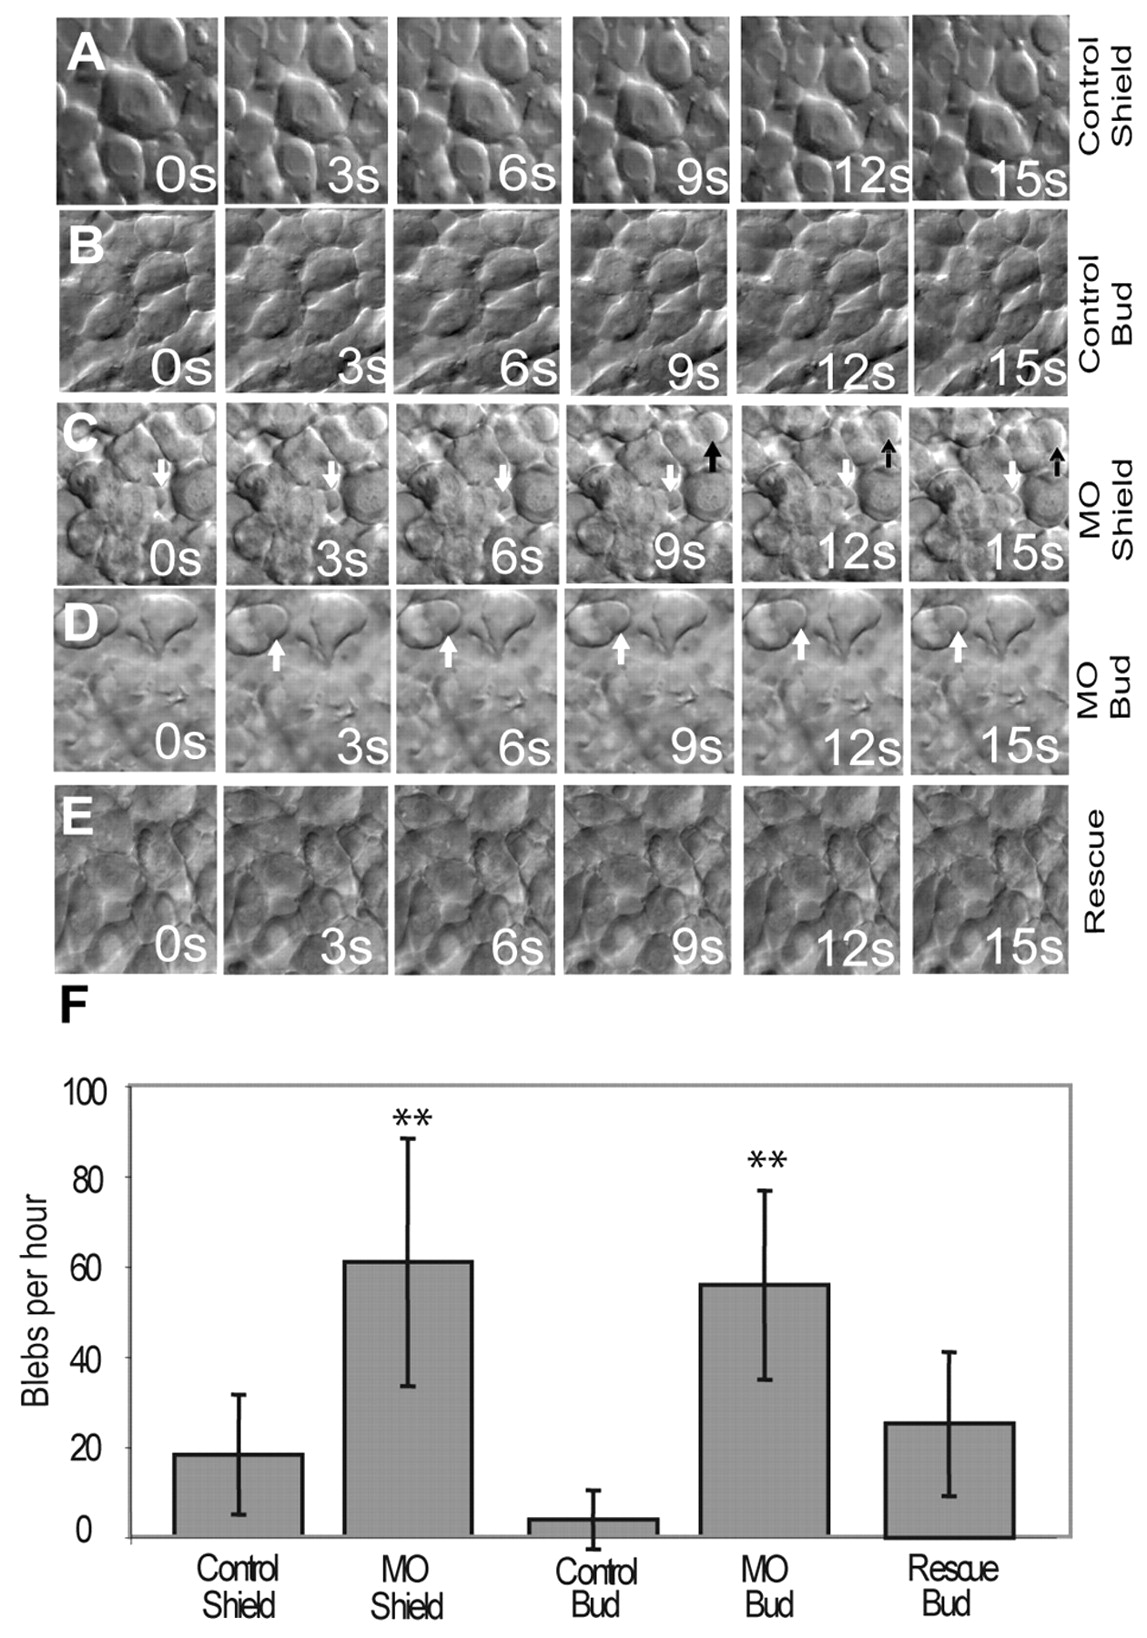
Fig. 5 Mypt1 inhibits bleb-like protrusive activity. (A-E) Membrane protrusive activity of mesodermal cells at shield and bud stages was determined by time-lapse microscopy. Shown is the behavior of mesodermal cells in control zebrafish embryos at shield (lateral cells, A) and bud (dorsal cells, B) stages, mypt1 morphants at shield (C) and bud (D) stages, and mypt1 mRNA and MO co-injected embryos (E). White and black arrows indicate bleb-like protrusions. s, seconds. (F) Quantification of the blebbing behavior shown in A-E. The y-axis shows the number of blebs per cell per hour. Note the large increase in protrusive activity in mypt1 morphants relative to the control at both time points. **, P<0.01.