
|
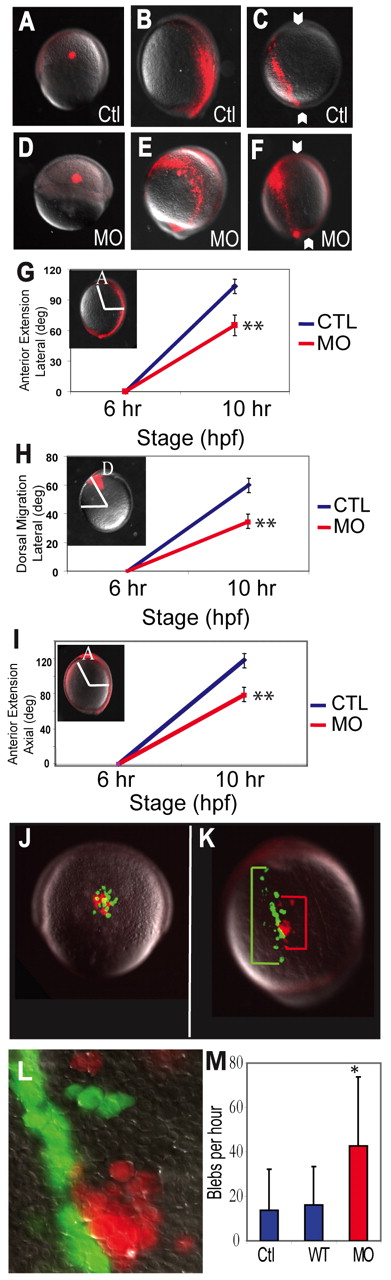
Fig. 3 Mypt1 regulates convergence and extension. (A-F) Distribution of labeled lateral cells at shield and bud stages. The fluorescent dye was uncaged at shield stage (A,D), and examined at bud stage in lateral (B,E) and dorsal (C,F) views of control (Ctl) and mypt1 morphant (MO) zebrafish embryos. Arrowheads indicate the notochord. (G,H) Quantification of the dorsal convergence and anterior extension of lateral cells in control and morphant embryos. (G) Anterior extension is defined as the angle between the anterior-most labeled cell and the dorsal side (lateral view, anterior at top). (H) Dorsal migration is defined as the angle between the site of activation at shield stage and the site of labeled cells at bud stage (animal pole view, dorsal at top, lateral to the left). (I) Migration of the axial mesoderm is calculated by measuring the angle between the dorsal side and the head mesoderm in the laterally labeled embryos (A-F). A, anterior; D, dorsal. (J-L)WT (green) and mypt1 MO (red) cells were transplanted into WT shield-stage hosts (J, lateral view) and the host embryos were allowed to develop until bud stage (K, dorsal view 50x; L, dorsal view 400x), when the extent of migration of both WT and MO cells was determined. Green bracket indicates the total extension of WT cells and the red bracket indicates the extension of morphant cells. (M) Quantification of blebs per hour of host control cells, transplanted WT cells and transplanted MO cells. *, P<0.05; **, P<0.01.