
Image
|
Figure Caption
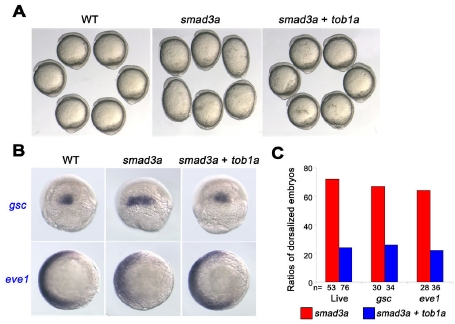
Fig. S9 Genetic Interaction between tob1a and smad3a (A) Live embryos at the 5-somite stages. Injection with 50 pg of smad3a mRNA resulted in dorsalized phenotypes, which were counteracted by coinjection with 100 pg of tob1a mRNA. (B) Overexpression of smad3a increased gsc expression and decreased eve1 expression at the shield stage, which were compromised by co-overexpression of tob1a. (C) Statistical data for smad3a and tob1a injections.
Figure Data
Acknowledgments
This image is the copyrighted work of the attributed author or publisher, and
ZFIN has permission only to display this image to its users.
Additional permissions should be obtained from the applicable author or publisher of the image.
Reprinted from Developmental Cell, 11(2), Xiong, B., Rui, Y., Zhang, M., Shi, K., Jia, S., Tian, T., Yin, K., Huang, H., Lin, S., Zhao, X., Chen, Y., Chen, Y.G., Lin, S.C., and Meng, A., Tob1 controls dorsal development of zebrafish embryos by antagonizing maternal beta-catenin transcriptional activity, 225-238, Copyright (2006) with permission from Elsevier. Full text @ Dev. Cell