
FIGURE
Figure 5
Figure 5
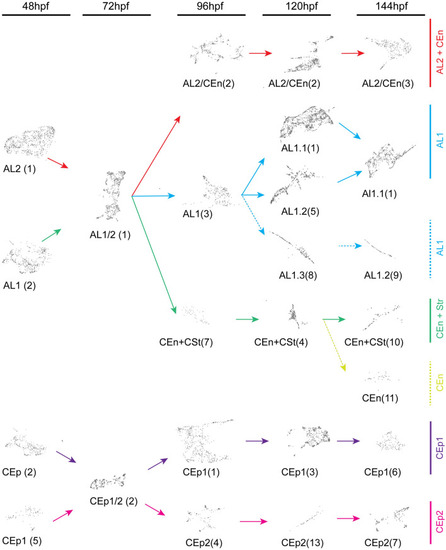
Cluster trajectories during early development of corneal epithelium, endothelium, stroma, and annular ligament. Developmental trajectories of individual clusters from each timepoint, 48–144 hpf, displaying temporal relationships. Numbers in brackets correspond to timepoint specific clusters (Fig. 3). Arrows indicate lineage relationships of the AL1 (blue), AL2/CEn (magenta), AL1/CEn + CSt (blue), CEn (light blue), CEp1 (purple) and CEp2 (pink) cell types. CEp lineages show early and dedicated commitment while AL lineages display multipotency for AL, CEn or CSt cell types. |
Expression Data
Expression Detail
Antibody Labeling
Phenotype Data
Phenotype Detail
Acknowledgments
This image is the copyrighted work of the attributed author or publisher, and
ZFIN has permission only to display this image to its users.
Additional permissions should be obtained from the applicable author or publisher of the image.
Full text @ Sci. Rep.